
Hackathon 10
This viz was my team's submission for Forrester's 10th Data Visualization Hackathon.
The task for this hackathon was to create a tool or a visualization for Forrester's vast report taxonomy. The complicated and multi-piece data set included all of the tags Forrester currently uses, report details, as well as data on search terms.
We chose to build a product that included a bit of search tool functionality, as well as a fun visualization, as it is a data viz hackathon in the first place.
The site starts with a welcome page. The first tab is intended for sales employees to quickly search for reports by tags or partial tags. The search produces a list of report names that link to the reports themselves.
The second tab is where we chose create a visual. I chose an "adjacency matrix", inspired by Mike Bostock's visualization of co-occurring characters in Les Miserables. In my visual, users can see the co-occurrence of any 2 tags in reports.
The last tab is a visualization of the increase and decrease in top search terms over the past year. I liked the central axis with negative naturally on the left and positive on the right for this challenge. This was a last minute add so it could use some aesthetic touches in the future.
My role in this project was to build the tools. Due to some re-shuffling of teams and team members, I ended up being the only developer, so I constructed the full site.
Tools: HTML, CSS, Bootstrap, Javascript, D3.js, JQuery, Adobe Illustrator

Welcome page

Search tool with results (shown on right)

Adjacency matrix visualization (interactive)

Full matrix
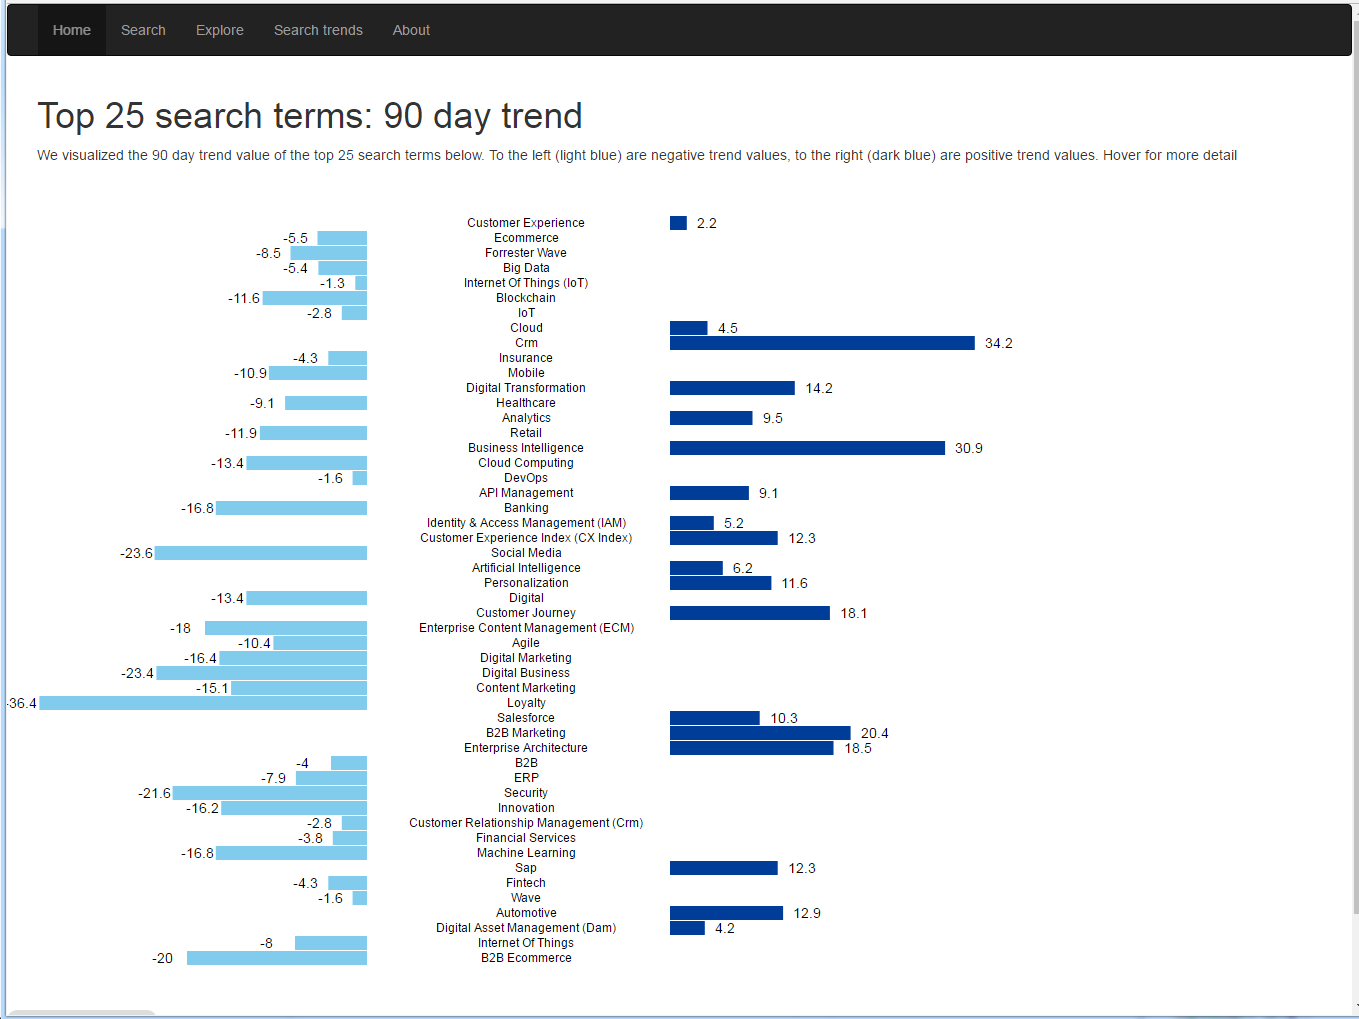
Search term increase/decrease visualization