


Your Custom Text Here
This viz was my team's submission for Forrester's 9th Data Visualization Hackathon.
The theme of this hackathon was "a day in the life at Forrester." Teams were free to use any data source and design that they thought would capture what a day (or days) at Forrester is like.
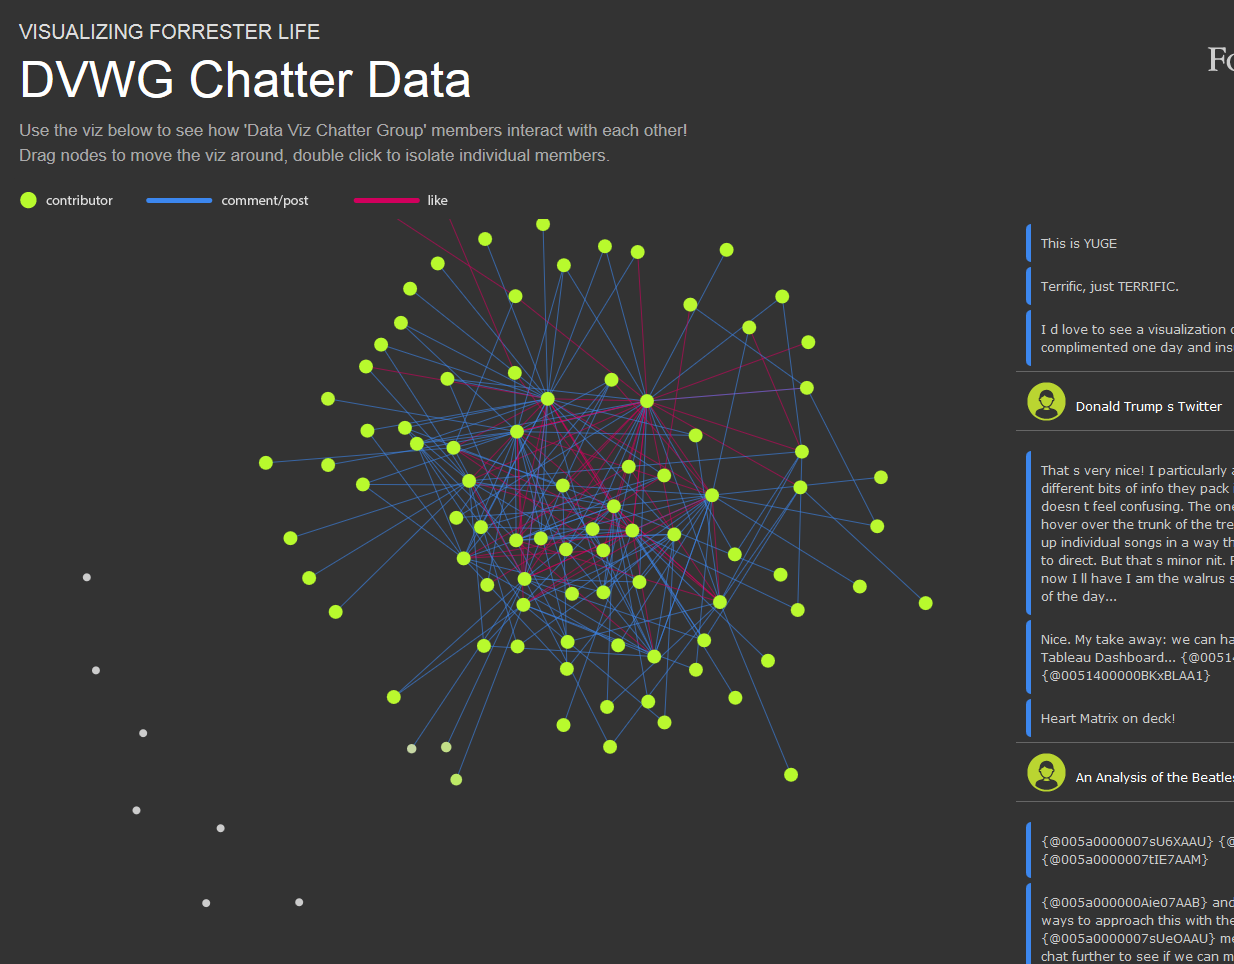
We chose to scrape data from Chatter, which is a Salesforce version of intra-company Facebook or Twitter feed. We have a specific Chatter "group" designated specifically for Data Viz, so we chose to pull the data from this group and visualize the interactions between contributors.
The viz was built using code from bl.ocks.org, the force-directed graph in particular. My role was to help design and edit the structure of the page, such that it had an aesthetic that matched Forrester's branding as much as possible. I also implemented and customized the feed on the right to roll in as the graph constructed itself.
Tools: HTML, CSS, Javascript, D3.js, JQuery
This viz was my team's submission for Forrester's 9th Data Visualization Hackathon.
The theme of this hackathon was "a day in the life at Forrester." Teams were free to use any data source and design that they thought would capture what a day (or days) at Forrester is like.
We chose to scrape data from Chatter, which is a Salesforce version of intra-company Facebook or Twitter feed. We have a specific Chatter "group" designated specifically for Data Viz, so we chose to pull the data from this group and visualize the interactions between contributors.
The viz was built using code from bl.ocks.org, the force-directed graph in particular. My role was to help design and edit the structure of the page, such that it had an aesthetic that matched Forrester's branding as much as possible. I also implemented and customized the feed on the right to roll in as the graph constructed itself.
Tools: HTML, CSS, Javascript, D3.js, JQuery
bl.ocks.org inspiration
Force-directed graph builds in